I started HiredSupport in 2016. We worked with multiple clients ranging from small medium businesses to large corporations. Over the years, with continuous feedback, we made a lot of improvements in call center outsourcing services, operations, and client management. The constant feedback loop helped me to retain 100+ clients over a period of time.
These feedbacks have a fancy name for them – ANALYTICS! And when it comes to call center feedback, it’s called contact center analytics.
Let’s discuss more about it.
What is Contact Center Analytics?
Contact center analytics help to gain valuable insights that set the direction to improve operations, reduce costs, and assure quality. For example, the following are some of the analytical insights that helped us to make the right decision for improvements:
- The churn rate is high, so we need to work on client satisfaction.
- The client satisfaction score is low, so we need agents to maintain better quality.
- Customers are having issues connecting on call, so we need a better landline system to improve the quality.
You should note that I used the words “churn rate” and “client satisfaction”. These are NOT analytics; these are KPIs.
This brings us to the next part if KPIs and Analytics the same?
Difference Between Contact Center Analytics and Contact Center KPIs?
Analytics represents the process of finding insights out of the KPIs (key performance indicators) that one decides for a campaign. KPIs are the subset of analytics.
For example, I measured that the churn rate is high, so we need to work on client satisfaction.
“Churn Rate” would be a metric.
“We Need to Work on Client Satisfaction” is an insight drawn from the analytics.
With this example in mind, you can use the following table to differentiate between them:
| Aspect | KPIs | Analytics |
| Definition | A specific metric | The process of interpreting metrics |
| Example | Churn Rate – Measures the percentage of clients lost over a specific period. | Analyzing churn rate data as one point to understanding why clients are leaving |
| Purpose | Tracks performance towards a key goal (e.g., client retention). | Transforms raw data into insights that can inform decision-making. |
In short:
- KPIs are the key metrics that indicate whether you’re reaching your goals.
- Analytics is the process of interpreting those metrics to provide actionable insights.
Why Do Business Owners Need Contact Center Analytics?
Like I said in the beginning, a call center needs constant improvements in its processes like any other business. Contact center analytics help you to gain valuable insights while making the right decisions.
It can help you with the following aspects:
- To identify problems
- To manage agents’ performance
- To manage client satisfaction
- To manage customer satisfaction
In addition to the problems listed above, it can help you to analyze every single business problem that you may come across.
11 Types of Call Center Analytics that Helped Me to Retain 100+ Clients
To retain a client, I analyzed that we need to fulfill the following criteria:
- The expectations are delivered
- The client should feel that it’s ROI positive
- The agent should perform in a productive manner
- A customer should feel satisfied with our service
Once I analyzed that there were four potential buckets where I needed to produce the quality, I created analytics for each bucket.
Here’s how:
| Goals | Analytics Type |
|---|---|
| The expectations are delivered | Task Urgency Analytics Resource Availability Analytics |
| The client should feel that it’s ROI positive | Cost per Call Analytics Revenue per Call Analytics Customer Retention Analytics |
| The agent should perform in a productive manner | Performance Analytics Workload Analytics Quality Assurance Analytics |
| A customer should feel satisfied with our service | Customer Satisfaction (CSAT) Analytics Net Promoter Score (NPS) Analytics Escalation Analytics |
To Do Exercise:
1. Task Urgency Analytics
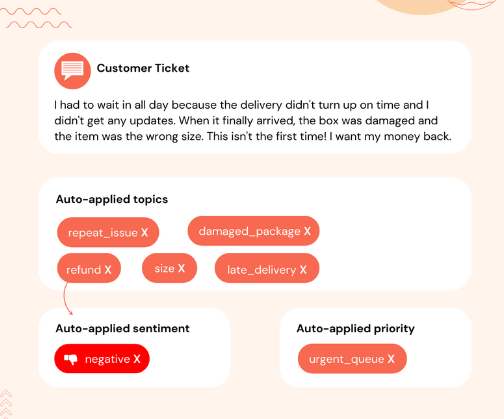
Task urgency analytics helps to assess and analyze the tasks based on their level of urgency. This helps to measure the urgent task that needs priority and the tasks that can be scheduled for later.
If a business owner has an expectation from the contact center that specific types of customers should be prioritized when handling customer service, Task Urgency Analytics helps you to prioritize them effectively.
For example, Sentisum is software that automatically prioritizes tickets based on urgency, see below:
To process these analytics, I used to measure the following metrics under it:
- Percentage of tasks completed by due Date
- Average time to complete tasks
- Number of high-priority tasks completed on time
- Average priority rating of completed tasks
- Task backlog size
2. Resource Availability Analytics
Resource availability analytics again comes under the umbrella of delivering expectations. It analyzes if there were some important chats and your contact center didn’t have an agent to assign.
For example, see below how CloudTalk helps to measure the availability of agents:
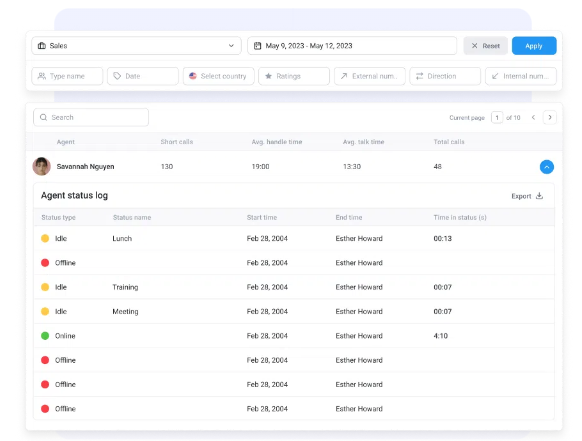
The unavailability of any agent while a potential customer is waiting can also lead to the loss of revenue. In such cases, a contact center owner should analyze the frequency of it and if they need any additional resources to add.
To process these analytics, I used to measure the following metrics (KPIs) under it:
- Agent Availability Rate
- Unassigned Chat Rate
- Peak Time Coverage Rate
3. Cost per Call Analytics
Cost per call analytics shows how much it costs your business every time an agent answers a call. It helps you understand where your money is going and whether you’re spending too much on each customer interaction. This way, you can find ways to cut costs without affecting service.
To process these analytics, I used to measure the following metrics (KPIs) under it:
- Average Cost per Call
- Labor Cost per Call
- Technology Cost per Call
- Overhead Cost per Call
- Cost per Resolved Call
4. Revenue per Call Analytics
Revenue per Call Analytics tells you how much money you’re making from each call. It helps you figure out if your call center is making enough profit on each customer interaction, making it easier to know how to grow your business.
To process these analytics, I used to measure the following metrics (KPIs) under it:
- Average Revenue per Call
- Revenue per Sales Call
- Revenue from First Call Resolution (FCR)
- Revenue per Upsell/ Cross-Sell Call
- Revenue per Agent
5. Customer Retention Analytics
Customer Retention Analytics tracks how well you keep your customers coming back. It helps you find out if customers are happy with your service or if they are leaving for other companies. Keeping more customers means more long-term success.
To process these analytics, I used to measure the following metrics (KPIs) under it:
- Customer Retention Rate
- Churn Rate
- Repeat Call Rate
- Average Customer Lifetime Value (CLV)
- Customer Loyalty Score
6. Performance Analytics
Performance Analytics helps measure how well your agents and call center are doing. It shows if agents are handling calls quickly and efficiently. It’s like a report card for your team, letting you know who’s doing well and who needs some help.
To process these analytics, I used to measure the following metrics (KPIs) under it:
- Average Handling Time (AHT)
- First Call Resolution (FCR)
- Call Resolution Rate
- Agent Productivity Score
- Call Abandonment Rate
7. Workload Analytics
Workload Analytics shows how busy your agents are. It helps make sure agents aren’t overworked or underworked by looking at how many calls they’re handling. This way, everyone is working efficiently, and no one gets burnt out.
To process these analytics, I used to measure the following metrics (KPIs) under it:
- Call Volume per Agent
- Agent Utilization Rate
- Average Calls Handled per Day
- Peak Time Workload Distribution
- Agent Occupancy Rate
8. Quality Assurance Analytics
Quality Assurance Analytics checks how well agents are performing and if they are following the right processes. It ensures your customers get the best service and that agents are sticking to the rules. This helps improve service quality overall.
To process these analytics, I used to measure the following metrics (KPIs) under it:
- Call Quality Score
- Adherence to Call Scripts
- Compliance Rate
- Call Monitoring Frequency
- Agent Coaching Success Rate
9. Customer Satisfaction (CSAT) Analytics
Customer Satisfaction (CSAT) Analytics measures how happy your customers are with your service. It’s like asking customers if they’re satisfied after every call. If the score is high, you’re doing great. If not, it’s time to improve.
To process these analytics, I used to measure the following metrics (KPIs) under it:
- CSAT Score
- Post-Call Survey Response Rate
- Positive vs. Negative Feedback Ratio
- CSAT Trends Over Time
- Average Customer Sentiment
10. Net Promoter Score (NPS) Analytics
Net Promoter Score (NPS) Analytics tells you how likely customers are to recommend your service to others. If customers are recommending you to their friends, it means they’re really happy with your service.
To process these analytics, I used to measure the following metrics (KPIs) under it:
- Net Promoter Score (NPS)
- Promoter vs. Detractor Ratio
- NPS Response Rate
- NPS Growth Over Time
- Customer Loyalty Index
11. Escalation Analytics
Escalation Analytics tracks how often calls are passed to higher-level support. It helps figure out if agents are solving problems on their own or if they need more help, which can affect customer satisfaction and call efficiency.
To process these analytics, I used to measure the following metrics (KPIs) under it:
- Escalation Rate
- Time to Resolve Escalated Calls
- Escalation Frequency per Agent
- Percentage of Escalated Calls Resolved
- Escalation Impact on Customer Satisfaction
Top 3 Call Center Analytics Software
While there are many call center analytics software available in the market, the following are the most renowned in the industry.
Please note that choosing software totally depends upon your requirements. While these software are good to use, there’s a possibility that they may not be a good fit for your business, so it’s important to
- Know your requirements
- Get a free software demo to set expectations
- Choose the provider that fits your needs and your budget
1. Nextiva
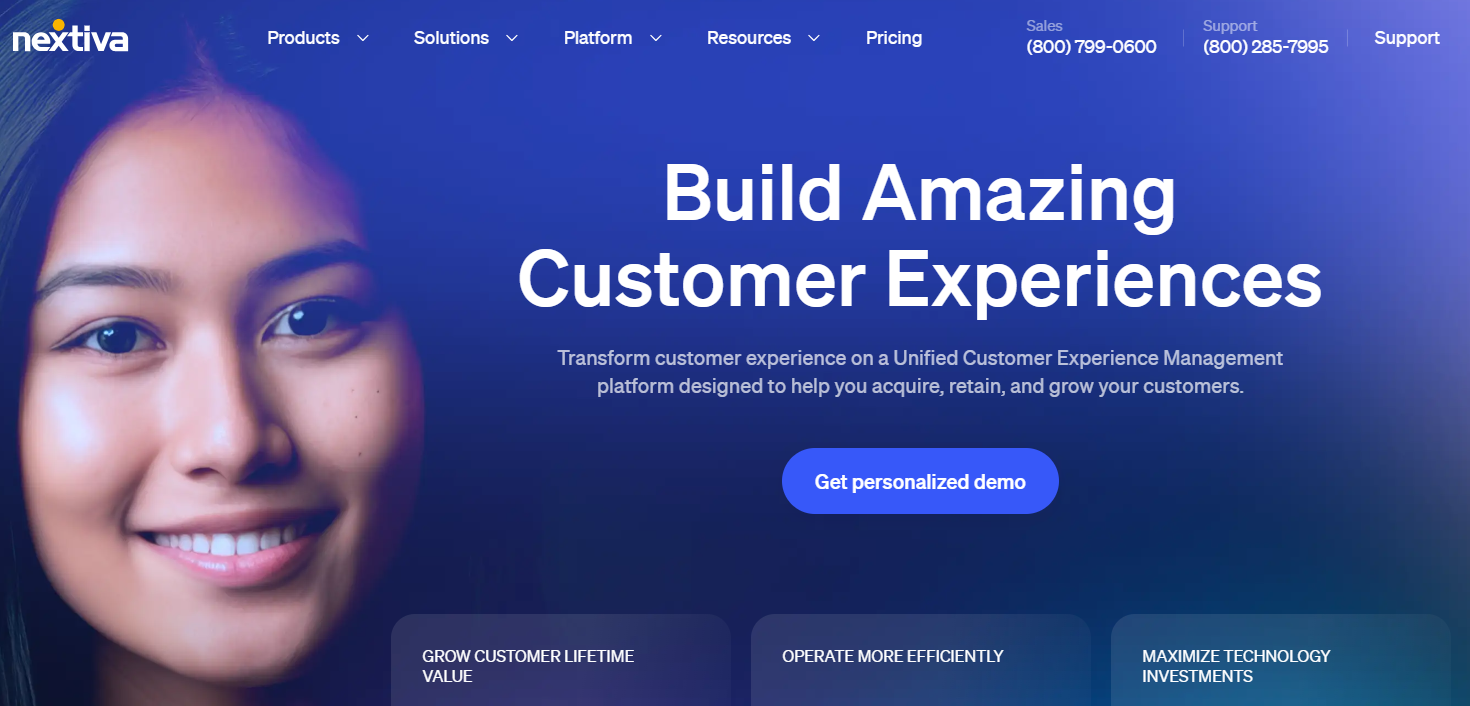
Nextiva is a company in Scottsdale, Arizona, that helps people talk better! They make special tools that let businesses use phones and other tech from the cloud! Right now, 150,000 businesses use Nextiva to stay connected and help their customers.
Following are the analytics and metrics that you collect from Nextiva:
- Call Analytics
- Customer Interaction Metrics
- Performance Reports
- Satisfaction Scores
Pricing
Nextiva pricing ranges from $20 to $60 per month.
2. Five9
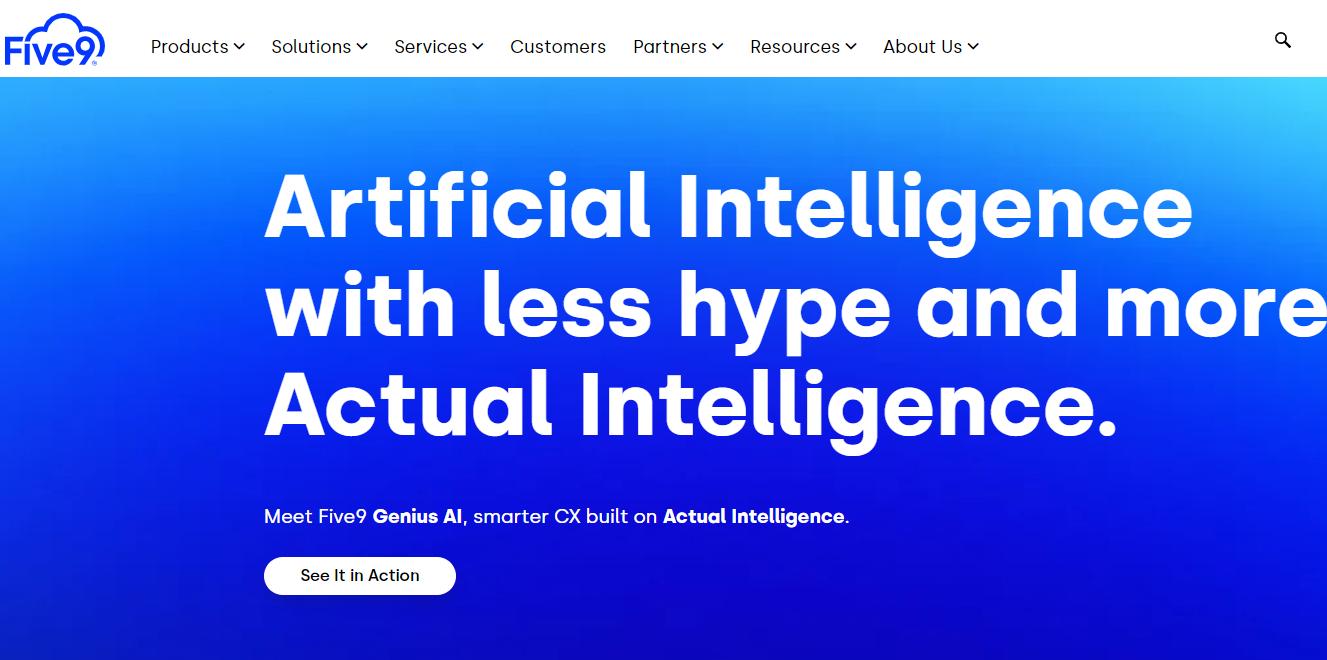
Five9 is another cloud contact center software. The good point about Five9 is that it provides a blended solution for outbound, inbound, and multi-channel operations.
It enables to to communicate with agents using phone, email, chat, and many more. Furthermore, you can easily integrate with software like Salesforce and Zendesk
Following are the analytics and metrics Five9 provides:
- Call Analytics
- Customer Interaction Metrics
- Performance Reports
- Satisfaction Scores
- Agent Performance Metrics
- Queue Statistics
- Campaign Effectiveness Analysis
Pricing
Five9 pricing ranges from $149 to $229 per month.
3. TalkDesk

Used by more than 18,00 companies, TalkDesk supports businesses in terms of providing them with the best customer experience. The tool is designed to be simple and can be used by beginner-level users as well – people who don’t have any technology background.
Furthermore, the tool provides integrations with 60+ apps like Slack and Zendesk.
Following are the types of analytics and metrics that you can analyze using TalkDesk:
- Call Analytics
- Customer Interaction Metrics
- Agent Performance Metrics
- Service Level Agreements (SLA) Compliance
- Average Handle Time (AHT)
- First Call Resolution (FCR)
- Customer Satisfaction Scores
And many more.
Pricing
Five9 has a pricing range of $175 per month. However, it offers customized pricing as well.
Conclusion
You’ll find tons of call center analytics to go through. Your job as an analyst is to avoid the noise and choose the right analytics that are helpful and that can drive the right decision makings.
Furthermore, analytics wasn’t the only point that helped me to retain these clients. There were a lot of additional factors as well that helped to deliver exceptional services to the clients.
And if you are a business owner who is struggling with maintaining an exceptional customer experience using these analytics, you can talk to me directly, and we can measure how you can improve your customer support.
![What is Shrinkage in the Call Center [Updated 2025]](https://www.hiredsupport.com/wp-content/uploads/2025/04/What-is-Shrinkage-in-Call-Center-1-300x169.png)